
Roofing demand typically peaks in spring through early fall, with storm-driven spikes that can significantly increase short-term workload in affected markets. Winter and early spring are your slowest, most predictable stretch. The single biggest priority right now: lock in marketing spend, inventory, and crew capacity well in advance of expected demand, not after the phones start ringing…
TL;DR:
- Contractors should prepare inventory and workforce plans at least 90 days before peak season to avoid spot market prices and scheduling delays.
- External signals like permit activity, insurance claim clusters, and weather patterns can forecast demand surges more accurately than relying solely on historical data.
- Storm events can amplify demand up to nine months in regions affected, making regional demand patterns more important than national averages.
- Building and tracking a seasonality index helps contractors plan resources and marketing campaigns more precisely throughout the year.
- Off-season marketing should focus on pre-booking discounts and nurturing leads, while peak season campaigns need to emphasize speed, trust, and scheduling clarity.
Table of Contents
- Understanding Roofing Seasonality Trends: The Month-by-Month Calendar
- How Do Climate Zones and Storms Change Roofing Demand?
- Operational and Financial Implications of Seasonal Swings
- When Should You Run Which Roofing Marketing Campaign?
- How Do You Build a Roofing Seasonality Index?
- Your 12-Month Roofing Operations Checklist
- A Real-World Proof Point: Scaling Through Seasonal Cycles
- Why the Storm-Chaser Mindset Is Holding Contractors Back
- Results Digital: Making Seasonality Predictable, Not Chaotic
- Where to Track Weather, Claims, and Industry Trend Data
- Sources
Understanding Roofing Seasonality Trends: The Month-by-Month Calendar
Roofing seasonality trends follow a fairly consistent rhythm in most of the country, and the pattern is driven by two forces working together: weather that makes installation possible, and homeowner behavior that makes buying likely.
Spring, roughly March through May, is the ramp-up. Winter damage becomes visible once snow melts and rain starts finding its way through weak spots. Crews that spent January doing repairs and estimates start booking full installs. Summer, June through August, is your steady-state season. Temperatures are ideal for most materials, daylight hours are long, and crews can run at full capacity. Late summer into early fall brings the wildcard: storm season. Hail and wind events cluster heavily in this window across the Midwest and South, and a single event can compress six months of demand into six weeks.
Fall, September through November, is finishing season. Homeowners who put off a replacement all summer rush to get it done before winter, and contractors are racing daylight and temperature windows before materials become harder to work with. Winter, December through February, is the quiet period in most climates. Volume drops, but it doesn’t disappear entirely, especially in the South.
Temperature is not just a comfort issue. It’s a technical constraint. Cold-weather application guidance from the Asphalt Roofing Manufacturers Association recommends storing modified bitumen materials in heated areas for 24 hours or more before use, since most manufacturers set minimum application temperatures around the typical range specified by manufacturers. Go below that threshold without adjusting your process and you risk poor adhesion, cracking, and callbacks that cost more than the job was worth.
Here’s how that typically breaks down across a working year:
- Spring (March to May): Repair backlog clears, installs ramp up, moderate volume.
- Summer (June to August): Peak install capacity, steady bookings, highest crew utilization.
- Late summer to early fall (August to October): Storm season overlays normal demand, creating sharp regional spikes.
- Fall (September to November): Rush to finish before winter, strong close-out volume.
- Winter (December to February): Lowest volume nationally, repair and emergency work dominates.
Contractors who track this pattern against their own books usually find their own numbers echo the industry’s broader story, and the 2026 State of the Roofing Industry report shows a large majority of contractors expect volumes to increase in 2026, with many diversifying services specifically to smooth out that seasonal curve.
How Do Climate Zones and Storms Change Roofing Demand?
Seasonality is not one national curve. It’s a dozen regional curves stacked on top of each other, and treating your market like the national average is how contractors miss their own busy season.
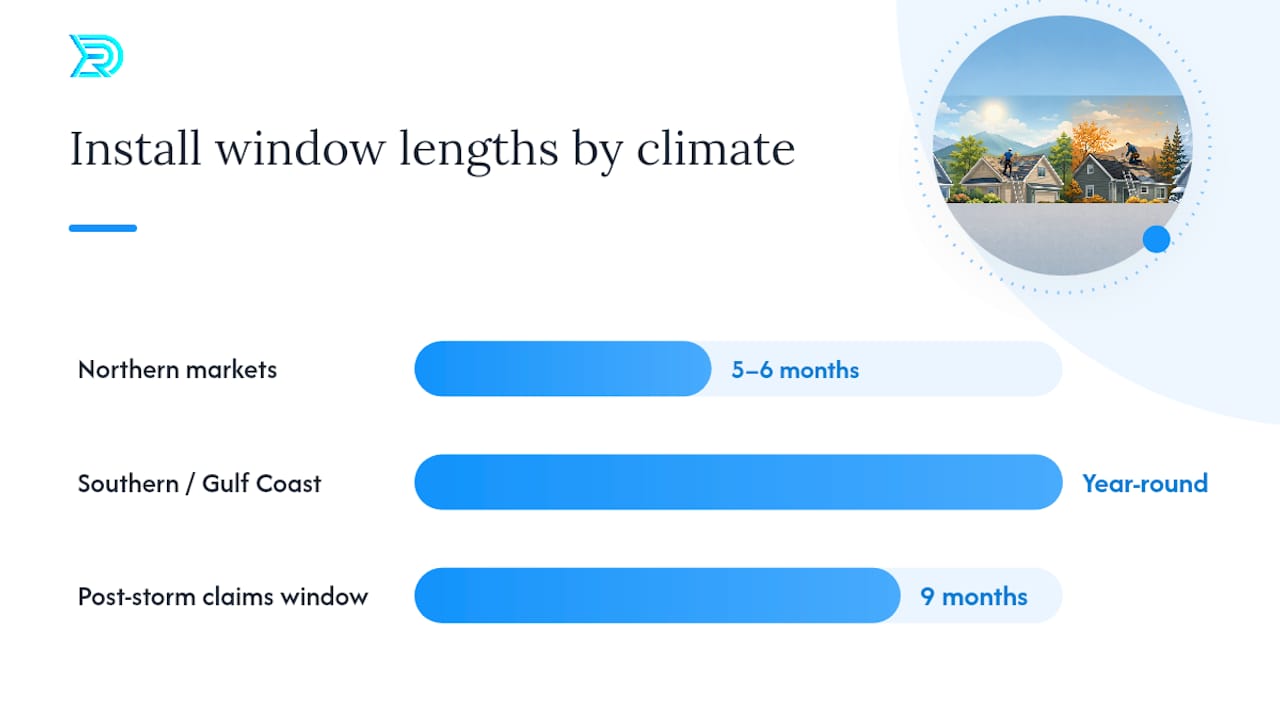
Northern markets, think Minnesota, Wisconsin, upstate New York, work with a genuinely short season. Frozen ground, snow load, and sub-40-degree stretches can shrink the practical install window to five or six months a year. Southern and Gulf Coast markets operate closer to year-round, but they trade winter slowdowns for summer heat constraints and monsoon-season downpours that shut down install days without warning. A contractor in Phoenix and a contractor in Duluth are not fighting the same calendar at all.
Storms complicate this further. Hail and wind events don’t respect a tidy seasonal calendar. They create demand shocks that can outweigh normal seasonality entirely. Storm damage drives roughly a significant portion of residential roof replacements, and regional claim clusters can push demand up substantially within nine months of a major event hitting an area.
Storm impact snapshot: A single hail event can compress nearly a year’s worth of typical demand into a nine-month claims window for the surrounding zip codes.
That reality has split the industry into two operating models. Storm-chaser crews follow the weather, moving into hit zones to capture insurance-driven volume, then move on once the work dries up. Retail-focused contractors build a steady local pipeline and treat storm work as a bonus, not a business model. Neither approach is wrong, but storm-chaser marketing and retail marketing require different playbooks entirely, and contractors who blend the two without adjusting strategy often underperform both.
The smartest operators now watch three signals as leading indicators rather than waiting for the phone to ring:
- Local permit activity, which shows where crews are actually pulling jobs before sales get recorded anywhere public.
- Insurance claim clusters reported after major weather events.
- NOAA’s seasonal storm climatology, which tracks hurricane and severe weather patterns by region and time of year.
Operational and Financial Implications of Seasonal Swings
Seasonality doesn’t just change your sales calendar. It reshapes crew planning, inventory strategy, and cash flow, and the contractors who treat those three as separate problems usually end up solving none of them well.
Crew scaling is the first pressure point. When demand surges in late summer, you have three real options: hire temporary crews, bring in subcontractors, or ask existing crews to work longer hours. Temp hires need training time you often don’t have during a storm surge, so many contractors pre-vet a subcontractor bench during slow months so it’s ready to activate the moment claim volume spikes.
Inventory is the second. Waiting until demand hits to order materials means paying spot prices and risking delays. A better approach:
- Identify your highest-turn SKUs (shingles, underlayment, flashing) and negotiate 90-day price locks with suppliers before peak season starts.
- Keep safety stock on those SKUs sized to your busiest historical month, not your average month.
- Renegotiate supplier terms annually, using your prior year’s volume as leverage for better pricing.
Pro Tip: Ask your primary supplier for a written 90-day price lock every January. Most will grant it to keep your volume, and it insulates you from the price spikes that hit everyone else scrambling in July.
Cash flow is the third, and it’s the one that quietly sinks otherwise healthy contractors. Heavy Q4 invoicing followed by a slow Q1 creates a real liquidity gap. Work gets billed in November and December, but cash doesn’t land until January or later, right when expenses like insurance renewals and equipment payments come due. LevelCFO’s analysis of this timing problem recommends staged billing, a standing line of credit, and early-book discounts that pull some Q1 revenue forward into Q4, all as ways to smooth the gap rather than absorb it as a shock every year.
When Should You Run Which Roofing Marketing Campaign?
Your marketing calendar should mirror your seasonality curve, not fight it, and the biggest budget mistake in this industry is spending the most money during the months when demand needs it least.
Winter and shoulder-season months are for building the pipeline, not chasing it. This is when future-book incentives work best: discounts for homeowners who commit now for a spring install slot. Price guarantees and financing offers also land well here, since a slower-moving buyer wants reassurance more than urgency. Email and retargeting campaigns are your cheapest tools in this window. Reactivation email sequences can turn old estimates and past leads into booked jobs without new ad spend, and retargeting keeps warm leads from going cold while they compare quotes over the winter.
Peak season flips the playbook. Once storm season or the summer rush hits, speed matters more than nurture. Emergency-response ads that get in front of homeowners within hours of a storm convert far better than a slow-drip campaign. Review amplification matters here too, since a homeowner comparing three quotes after a hailstorm often picks based on trust signals, not price alone. Scheduling logistics become part of your marketing message: telling a prospect exactly when a crew can start closes deals faster than a vague “we’ll be in touch.”
- Off-season (winter/shoulder): Future-book discounts, financing offers, email nurture, retargeting.
- Peak season (summer/storm): Emergency-response ads, review-driven trust building, fast scheduling messaging.
Pro Tip: Budget your off-season marketing spend 60 to 90 days before you expect demand to hit. Contractors who wait until the storm hits to turn on ads are bidding against everyone else in the market at the same time, driving cost per lead up right when they need volume most.
How Do You Build a Roofing Seasonality Index?
A seasonality index turns gut feeling into a planning tool, and building one takes an afternoon with a spreadsheet, not a data science degree.
Pull 36 months of monthly revenue. Divide each month’s average by your overall monthly average across the full period. A result above 1.0 means that month typically outperforms your average; below 1.0 means it lags. The methodology RoofPredict outlines for tracking multi-year seasonal patterns also recommends normalizing for one-off outliers, like an unusually large storm year, so a single freak event doesn’t distort your baseline going forward.
Three external signals consistently improve forecast accuracy beyond your own historical data:
- Permit trends: Rising building permits in your service area signal upcoming construction and repair activity before it shows up in your lead flow.
- Insurance claim clusters: Regional spikes in filed claims after a storm event predict demand with a fairly tight time lag.
- Contractor activity data: Real-time job-site activity often outpaces traditional forecasting because it shows where crews are working before finished sales get recorded anywhere.
Permit monitoring services, weather and climate feeds, and CRM platforms with built-in forecasting features can pull these signals into one dashboard rather than three separate browser tabs. A CRM workflow built for roofing lead capture makes it far easier to tie these external signals back to your actual lead volume and job close rate.
Your 12-Month Roofing Operations Checklist
Aligning procurement, staffing, and campaigns with seasonality works best on a countdown, not a calendar page you flip once a month.
- 12 months out: Lock annual supplier agreements and set your seasonality index baseline for the year.
- 6 months out: Confirm subcontractor bench for peak months and finalize price locks on top SKUs.
- 3 months out: Launch shoulder-season marketing (future-book offers, email nurture) and begin safety-stock buildup.
- 0 to 30 days out: Activate peak-season ad campaigns, confirm crew schedules, and monitor storm and permit signals weekly.
Track three metrics through the cycle: backlog in weeks, your seasonality index by month, and lead-to-job conversion within 90 days of first contact.
A Real-World Proof Point: Scaling Through Seasonal Cycles
Results Digital helped a Florida roofing company grow from 3 crews to 18 before it sold for $60 million, largely by aligning marketing spend and lead timing with storm and seasonal cycles instead of running flat year-round budgets. The levers that mattered: forecasting lead volume ahead of storm season, CRM-integrated follow-up, and exclusive-market positioning that kept competitors off the same keywords. After any season, track backlog weeks, gross margin per job, and lead cost by channel to see what actually worked.
Why the Storm-Chaser Mindset Is Holding Contractors Back
The conventional advice in this industry still treats storm work as the goal and retail demand as the fallback. That framing has it backwards. Storm-driven jobs are real and profitable, but they’re volatile by nature, and building a business plan around volatility is how contractors end up with 18-crew summers and 3-crew winters.
What the data actually supports is a hybrid built on timing discipline: treat your local, non-storm demand as the base you build a business on, and treat storm activity as an accelerant you’re prepared to capture when it hits, not something you chase into other territories. The contractors thriving right now aren’t the ones with the biggest storm response team. They’re the ones who had marketing, inventory, and crew capacity already staged 60 to 90 days before anyone else even saw the forecast.
If there’s one habit worth prioritizing above all others, it’s building that seasonality index and actually checking it monthly. Most contractors know their season “feels” busy or slow. Few can tell you their actual seasonality index by month, and that gap is exactly where competitors with better data pull ahead.
— Results
Results Digital: Making Seasonality Predictable, Not Chaotic
Resultsdigitalus is the alternative to guessing your way through peak season. We build the marketing calendar, CRM workflow, and paid channel timing around your actual seasonality index, not a generic industry average, so your ad spend ramps up before demand hits rather than after your competitors already grabbed the leads.

Our exclusivity model means we partner with only one roofing company per trade per market. While your competitors are bidding against three other local roofers for the same storm-related keywords, your campaigns run without that internal price war. There’s no long-term contract locking you in, either. We earn the relationship every month by showing results tied to your actual booking calendar, not a generic playbook that ignores your region’s storm patterns and install windows.
If your off-season marketing has been an afterthought instead of a plan, start with our off-season marketing strategies for contractors or explore digital marketing built for general contractors to see how a 60 to 90 day head start changes your busy season.
Where to Track Weather, Claims, and Industry Trend Data
A handful of sources cover most of what you need to forecast seasonal demand without building your own data operation.
The National Hurricane Center’s climatology tracks regional storm frequency and seasonal risk, useful for anticipating claim clusters before they hit. The Roofing Contractor 2026 State of the Industry report benchmarks contractor sentiment and technology adoption nationally. ToolBeltData’s market analysis quantifies storm-driven demand and contractor activity trends. The ARMA cold-weather bulletin governs safe application temperatures for material handling. And LevelCFO’s cash-flow analysis addresses the Q4 to Q1 liquidity gap that catches so many contractors off guard every winter.
Sources
- Roofing market trends: storm demand & contractor activity data — ToolBeltData
- 2026 State of the Roofing Industry | Roofing Contractor
- National Hurricane Center climatology
- ARMA technical bulletin: Cold-weather application recommendations
- Contractor October cash-flow problem — LevelCFO
