
Shared roofing leads run $40 to $120, exclusive leads run $125 to $400, pay-per-call and Local Service Ads fall between $45 and $150, and non-branded Google Ads averaged $124 per lead in Q1 2026. None of those numbers matter on their own. What matters is cost per signed job, which factors in your booked-inspection rate and close rate. Run that math before you buy anything.
TL;DR:
- Shared leads can have a high ghost rate and may require five or more leads to close a single job, making their apparent low cost misleading.
- Exclusive leads offer higher close rates of 12% to 18%, often resulting in similar or lower effective costs per signed job despite higher upfront prices.
- Speed is critical in storm-driven markets; responding within five minutes can significantly lower the true acquisition cost for shared leads.
- Effective cost per signed job depends heavily on booking inspection and close rates, which must be calculated alongside lead costs for accurate evaluation.
- Testing lead sources involves verifying exclusivity terms, lead freshness, response times, and having a clear replacement policy before scaling.
Table of Contents
- What Roofing Leads Cost by Type and Why the Price Tag Lies
- Channel-by-Channel Benchmarks: Where to Spend and When
- The Math: Calculating Your Real Cost Per Signed Job
- Why the Same Lead Can Cost You $35 or $200
- How to Test and Buy Leads Without Getting Burned
- What Applied Cost-Per-Signed-Job Tracking Looks Like
- Buy Leads or Build Your Own Pipeline?
- Get a Clear Read on Your Own Lead Economics
- Sources
What Roofing Leads Cost by Type and Why the Price Tag Lies
A $35 shared lead and a $200 exclusive lead can produce the same cost per signed job, or the “cheap” lead can cost you far more once you count wasted CSR hours chasing homeowners who already booked three other estimates. The sticker price only tells part of the story.
Here’s what each price tier actually buys:
- Shared leads ($40 to $120): Sold to three to five contractors simultaneously. Close rates hover around 4% because homeowners are fielding multiple calls, and the fastest caller usually wins the job. You’re buying a race, not a customer.
- Exclusive leads ($125 to $400): Sold once. Close rates climb to 12 to 18% because the homeowner isn’t being worked by four other companies at the same time. The premium buys focus, not just data.
- Pay-per-call and Local Service Ads ($45 to $150): LSA runs $45 to $150 per lead with a 15 to 25% close rate, putting cost per booked job around $300 to $600 in many markets. You pay per connected call, so vague inquiries get filtered out before you’re billed.
- Google Ads (self-managed, non-branded): Averaged $124 per lead in Q1 2026 benchmark data, with a wide spread depending on how tightly the campaign targets high-intent searches.
Job type moves every number above. A full roof replacement lead is worth more to buy than a minor repair lead because the ticket size justifies a higher acquisition cost, as detailed in our breakdown of how ticket size changes allowable lead spend. Storms compress the whole market: demand spikes push CPLs up across every channel as every contractor within driving distance chases the same insurance claims, while retail replacement markets stay comparatively stable year round.
Channel-by-Channel Benchmarks: Where to Spend and When
Not every channel deserves the same share of your budget, and the right mix depends on whether you’re chasing storm volume or building a steady retail pipeline.
- Google Ads: Branded search terms (your company name) average around $44 per lead, while non-branded terms average $124, with the middle 50% of accounts landing between $80 and $256. Budget for the higher end if you’re targeting “roof replacement near me” style keywords rather than your own brand name. Our guide to Google Ads management for roofers covers realistic monthly spend for meaningful volume.
- Local Service Ads: Frequently the lowest cost per booked job on the list when a company has strong review depth, since LSA rewards responsiveness and Google’s own vetting badge builds instant trust. It also surges hardest in storm windows, which is exactly when you need volume.
- Aggregators and shared marketplaces: Cheapest sticker price, highest ghost rate. Cap your spend here and treat it as supplemental volume, never your core pipeline.
- Canvassing and door-knocking: During active storm cleanup, canvassing can produce some of the lowest-cost signed jobs in roofing because you’re closing in person on the same visit. Outside storm windows, the labor cost per contact climbs fast.
- SEO and Google Business Profile: Slow to build, typically six to twelve months before meaningful volume, but the cost per lead trends down over time as rankings compound. This is the channel that eventually makes you less dependent on paid leads altogether.
A useful reference for comparing acquisition costs across all five channels side by side is our breakdown of roofing advertising channels.
The Math: Calculating Your Real Cost Per Signed Job
Here’s the formula you actually need:
- Start with your CPL (what you paid per lead, from your invoice or ad platform).
- Divide by your booked-inspection rate (the percent of leads who actually schedule an inspection).
- Divide that result by your inspection-to-close rate (the percent of inspections that turn into signed contracts).
- Add your loaded CSR/sales cost per lead (wages, commission, and overhead spread across leads handled).
$60 ÷ 0.50 = $120 per booked inspection. $120 ÷ 0.15 = $800 cost per signed job, before adding CSR labor.
$200 ÷ 0.70 = $286 per booked inspection. $286 ÷ 0.35 = $817 cost per signed job.
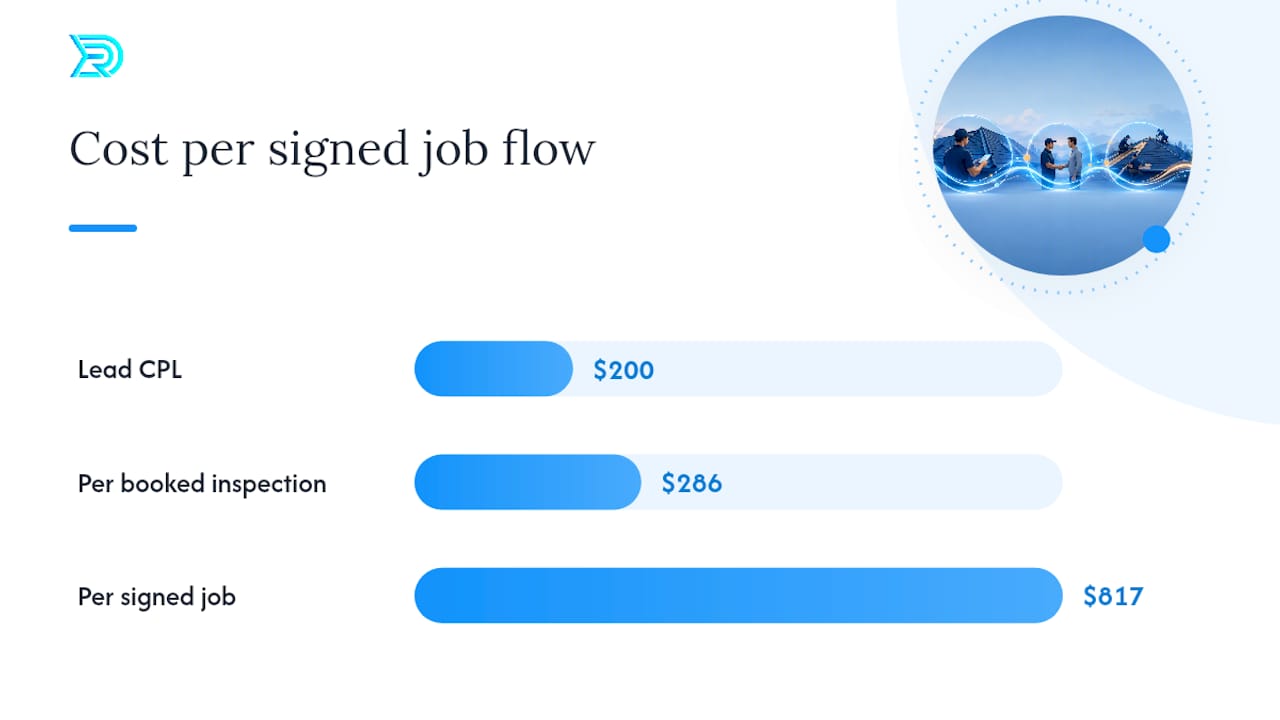
Those two numbers land almost identically, even though one lead costs three times more upfront. That’s the whole point of running this math instead of shopping on CPL alone.
Pro Tip: A 5-point swing in close rate changes cost per signed job more than a $50 swing in CPL almost every time. Fix your sales process before you shop for a cheaper lead source.
A common trap: cheap shared leads often hide expensive acquisition because the low CPL masks a close rate so thin it takes five or six leads to land one job. Run the full formula, including your conversion process from estimate to signature. Our estimate conversion checklist covers the close-rate side of that equation.
Why the Same Lead Can Cost You $35 or $200
Price on the invoice and effective cost are two different numbers, and the gap between them is almost always operational.
- Rotation slot matters more than most contractors realize. On shared leads sold to multiple buyers, callback speed determines who wins the job, and a slow response can turn a $35 shared lead into a $200 effective cost once you factor in the jobs you lose to faster competitors.
- Lead age drives ghost rates. A lead that’s five minutes old behaves very differently from one sitting in a queue for two hours; older leads answer less often and commit less when they do.
- CSR capacity caps your real throughput. If your team can’t call back within minutes during peak storm hours, you’re paying storm-tier prices for retail-tier response.
- Insurance-driven jobs carry different price sensitivity. Homeowners chasing a claim often care less about your quote and more about your speed and paperwork experience, which changes what “closing” actually requires.
Pro Tip: If you can’t call back inside five minutes consistently, buy fewer shared leads and shift budget toward exclusive or LSA, where speed matters less to your close rate.
How to Test and Buy Leads Without Getting Burned
Before you sign anything, get specific answers on four fronts:
- Exclusivity terms. Ask the vendor to define, in writing, how many buyers see the same lead and for how long.
- Sample data. Request real, recent lead records, not marketing screenshots, so you can judge freshness and detail quality.
- Timeliness SLA. Confirm how fast leads reach you after the homeowner submits, and what happens when that slips.
- Replacement policy. Nail down refund or replacement rules for bad numbers, duplicate submissions, or leads outside your service area.
Reject any vendor that won’t produce sample records or won’t put exclusivity terms in writing. That vagueness is the biggest red flag in this business.
Run a small pilot, 60 to 90 days, and track cost per signed job the whole way through before committing real volume. If a channel underperforms, our guide on why roofing ads underperform walks through the most common fixable causes before you assume the lead source itself is broken.
What Applied Cost-Per-Signed-Job Tracking Looks Like
Resultsdigitalus has worked exclusively with roofing, siding, gutter, and general contracting companies since 2015, built by a veteran-owned team that partners with only one company per trade in each market. That exclusivity model exists because lead economics shift fast, and a shared strategy across competitors dilutes the very metrics this article is built around.
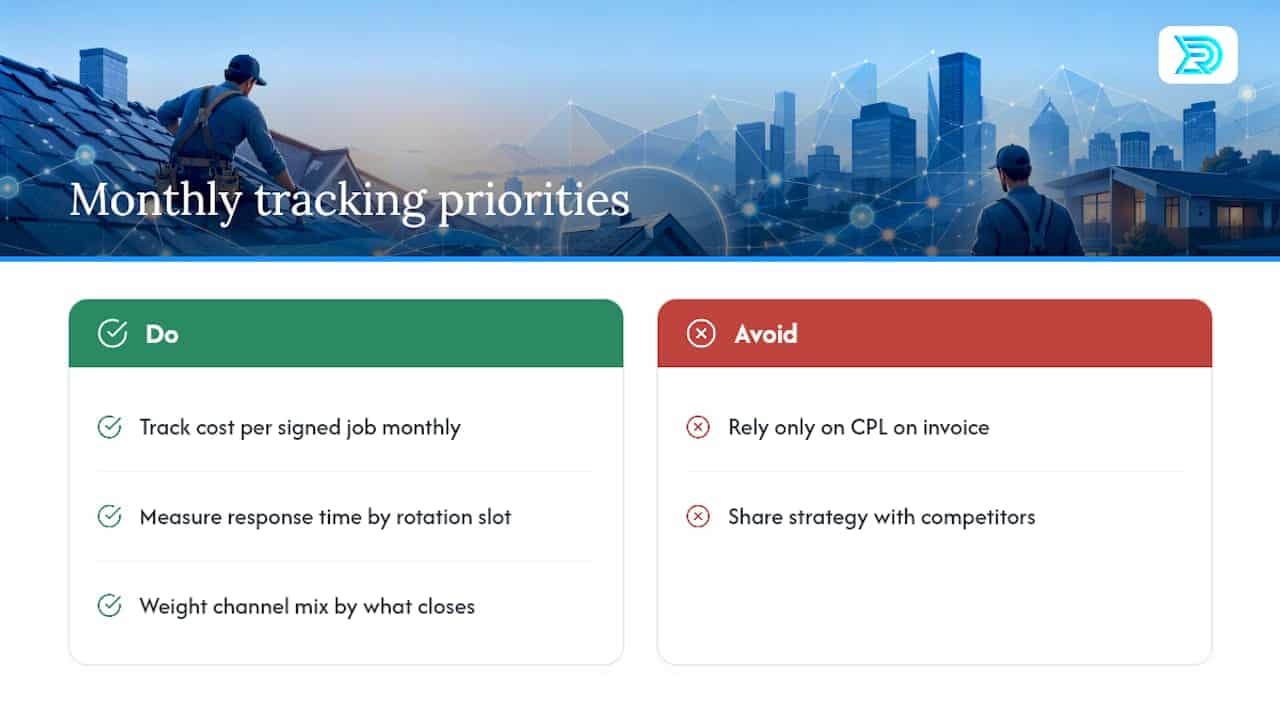
One Florida roofing client grew from 3 crews to 18 crews before selling the business for $60 million, a scale shift built on tracking the same fundamentals covered here: cost per signed job, response-time by rotation slot, and channel mix weighted toward what actually closes. Contractors who want to replicate that discipline should start by tracking those three numbers monthly, not just CPL on an invoice.
Buy Leads or Build Your Own Pipeline?
Buy leads when you need volume fast, especially to cover a storm window before your own channels can respond. Invest in SEO and Google Business Profile when you want compounding lower-cost leads over a longer horizon. Most contractors do best on a blended allocation: paid leads covering short-term gaps while owned channels build in the background. Treat the blend as a plan you revisit quarterly, not a decision you make once.
— Results
Get a Clear Read on Your Own Lead Economics
Resultsdigitalus is the alternative to guessing your way through vendor invoices and CPL spreadsheets: we run Google Ads, Local Service Ads support, SEO, and website builds exclusively for one roofing company per market, so every dollar you spend is measured against cost per signed job, not just clicks or form fills.
The goal is predictable acquisition cost, not just cheaper leads. If you want a confidential read on what you’re actually paying per signed job across your current channels, request a market check through our digital marketing services page or review our contractor lead generation model to see how the exclusivity structure changes the math in your specific market.
Sources
Benchmarks above draw from shared vs. exclusive lead cost-per-signed-job analysis, Q1 2026 Google Ads CPL data, channel benchmarks for LSA and aggregators, and wide-range market pricing data. Every figure here varies by metro and season, so treat these as starting benchmarks and confirm against your own local test results.
- Shared vs Exclusive Leads: The Real Cost-Per-Signed-Job Math (2026)
- Roofing Google Ads Cost Per Lead (2026 Benchmarks)
- How Much Do Roofing Leads Cost in 2026?
