
The simplest contractor marketing dashboard is a one-screen owner scorecard showing seven KPIs, reviewed for 30 minutes a week, producing exactly one fix that improves booked revenue. Nothing fancier. You don’t need forty tiles or a data science degree. You need a dashboard that answers one question every week: are we turning leads into profitable jobs, and if not, why?
A healthy contractor dashboard tracks seven KPIs that together tell you whether your marketing spend is producing booked work:
- Cost per lead (CPL) by channel
- Customer acquisition cost (CAC) by channel
- Customer lifetime value (CLV) by customer type
- Conversion rate by funnel stage
- Ad spend pacing
- Revenue attribution by source
- Booked jobs by day-of-week
Run this on a single screen. Review it every Monday for 30 minutes. Pick one fix, assign an owner, and move on. That cadence, more than any tool you buy, is what separates contractors who improve their marketing from contractors who just watch numbers scroll by.
Key Takeaways
A contractor marketing dashboard works when it reduces to one owner screen, seven KPIs, and a 30-minute weekly review that produces exactly one fix tied to booked revenue.
| Point | Details |
|---|---|
| Build the owner scorecard first | Show CPL, CAC, CLV, five funnel conversion rates, ad spend pacing, revenue attribution, and booked jobs by day. |
| Standardize source labels before integrating | Lock a master list of channel names at lead intake so joins across systems stay reliable. |
| Trace leads to revenue, not just counts | Connect call tracking, GA4, ad platforms, CRM, and accounting exports through a shared lead ID. |
| Run the same 30-minute review weekly | Cover source labels, missed calls, response speed, estimates, revenue, margin, and pick one fix with an owner. |
| Scale complexity only with data quality | Add segmentation by crew or zip code once source labeling and joins are clean enough to support it. |
Table of Contents
- What Goes Into a Contractor Marketing Dashboard Setup?
- The Seven KPIs Explained and What Each One Tells You to Do
- Which Systems Feed a Contractor Performance Dashboard?
- Tooling Options: Free, Mid-Market, or Enterprise?
- How Should You Run the Weekly Owner Review?
- What Mistakes Wreck a Contractor Advertising Dashboard?
- How Do You Maintain and Scale the Dashboard as You Grow?
- Results Digital: What Real Client Dashboards Look Like
- Turn Your Dashboard Into a Weekly Habit, Not a Report
- Where to Find Starter Templates and Official Guidance
- Why the Simple Dashboard Beats the Sophisticated One
- Sources
What Goes Into a Contractor Marketing Dashboard Setup?
Before you touch a single spreadsheet, answer this: what question do you, the owner, need answered every Monday morning? Usually it’s some version of “which channel is producing profitable booked jobs, and where are we leaking leads before they become revenue?” Everything else is noise until that question is answered.
Here’s the build sequence that gets you a working dashboard within a week, not a quarter.
- Write down the owner question first. Skip this step and you’ll build a dashboard full of metrics that look impressive but never prompt a decision.
- Map the minimum join path. You need four data points connected by a shared identifier: lead source, estimate status, booked job, and revenue. If you can’t trace a single lead through all four stages, your dashboard is decoration.
- Pick your front end. A shared Google Sheet works fine at low volume. Once you’re pulling from three or more sources, move to a Looker Studio template, which handles refreshes automatically instead of forcing manual copy-paste every week.
- Standardize your source labels before you connect anything. “Google,” “google ads,” and “GAds” are three different values to a spreadsheet, even though they mean the same thing to you. Fix this before integration, not after.
- Connect one feed at a time. Start with call tracking, since it usually has the cleanest lead-level data, then layer in ad platforms and your CRM.
- Test the join on ten real leads. Manually trace ten leads from first contact to booked job (or lost sale) and confirm every stage matches what’s in your dashboard.
- Set your first weekly review date. A dashboard with no scheduled review is just a report nobody reads.
Pro Tip: Build your source-label list as a locked-down dropdown menu at the point of lead intake, not as a cleanup task after the fact. Every hour spent fixing mislabeled sources later costs you three hours of decisions made on bad data.
Free tools work well here. Looker Studio can deliver the owner view quickly, though it demands more manual maintenance until you automate the connectors feeding it.
The Seven KPIs Explained and What Each One Tells You to Do
Numbers without a decision attached are trivia. Each of the seven KPIs should trigger a specific owner action when it moves outside a normal range.

CPL by channel tells you how much you’re paying for each raw lead from Google Ads, Meta, or your Local Services Ads listing. It’s useful for spotting a spike, but it lies to you in isolation. A channel with a $40 CPL that converts poorly can cost more per job than a $90 CPL channel that converts at twice the rate. That’s why CAC by channel, cost divided by booked jobs rather than raw leads, matters more. If CPL looks great but CAC is climbing, you have a conversion problem, not an ad spend problem.
CLV by customer type separates a one-time gutter cleaning customer from a full roof replacement client who calls back every few years for maintenance. Blending them into one average CLV number hides which jobs are actually worth chasing aggressively.
The five funnel conversion rates matter because each leak points to a different fix:
- Lead-to-estimate rate dropping usually means slow response times or bad phone scripts.
- Estimate-to-booked rate dropping usually means pricing, follow-up cadence, or sales skill.
- Booked-to-completed rate dropping points to scheduling or capacity issues.
- Completed-to-review rate dropping means you’re not asking for reviews at the right moment.
- Review-to-referral rate dropping suggests a service quality gap, not a marketing gap.
Ad spend pacing flags whether you’re on track to hit your monthly budget by day 15 or day 22, since uneven pacing usually means a campaign setting broke mid-month. Revenue attribution by source ties dollars, not just leads, back to the channel that generated them.
Which Systems Feed a Contractor Performance Dashboard?
Six systems typically hold the pieces of your funnel, and you don’t need to connect all of them on day one.
- Call tracking captures which number a lead dialed and ties that call back to a specific ad or keyword.
- GA4 shows website behavior and on-site form conversions.
- Google Ads and Local Services Ads report spend, clicks, and lead volume at the campaign level.
- Meta Ads Manager does the same for Facebook and Instagram campaigns.
- Your field service software or CRM holds the estimate, job, and scheduling data that marketing platforms never see.
- Your accounting export (QuickBooks or similar) has the actual invoiced revenue, which is the only number that really counts.
The fields that matter most: a unique lead or call ID, the UTM or campaign tag attached at first contact, an estimate or job ID, an invoice ID, and the final booked revenue amount. Miss any one of these and your funnel breaks at that stage.
You have three integration options depending on your volume and budget. Direct connectors (native integrations between your CRM and Looker Studio, for instance) require the least manual work but the most setup time upfront. Vendor CSV exports work for contractors doing under 100 leads a month who don’t want to pay for a connector subscription. A simple weekly CSV drop into a shared Sheets file is the lowest-cost option and often the right starting point, since dashboards can be built from CSVs and exports without ripping out systems you already use.
Whatever path you choose, keep a master source-label list and enforce it at the point of intake. This single habit prevents more dashboard confusion than any software upgrade.
Tooling Options: Free, Mid-Market, or Enterprise?
Your budget and lead volume should decide this, not what looks most impressive in a demo.
- Free tier: Looker Studio connected to Google Sheets, plus CSV exports from your call-tracking provider. This is the fastest path to a working dashboard and costs nothing beyond your own time, though it requires manual refreshing until you script the connectors.
- Mid-market tier: Attribution platforms like WhatConverts package call tracking and a ready-made dashboard layer into one monthly subscription, trading a recurring fee for far less setup work.
- Enterprise tier: Field-service platforms with built-in analytics layers bundle leads, bookings, quotes, invoices, and review metrics into pre-built dashboards, along with SLA alerts and cohort reporting, at a higher monthly cost that usually only makes sense once you’re running multiple crews or markets.
A rough rule for choosing: DIY it if you’re under $10,000 in monthly ad spend and comfortable in spreadsheets. Buy a mid-market platform once manual reconciliation eats more than two or three hours a week. Consider a marketing partner once you’d rather spend that time selling jobs than fixing dashboards, and Resultsdigitalus builds exactly this kind of transparent reporting for roofing and exterior contractors as a standard part of campaign management.
How Should You Run the Weekly Owner Review?
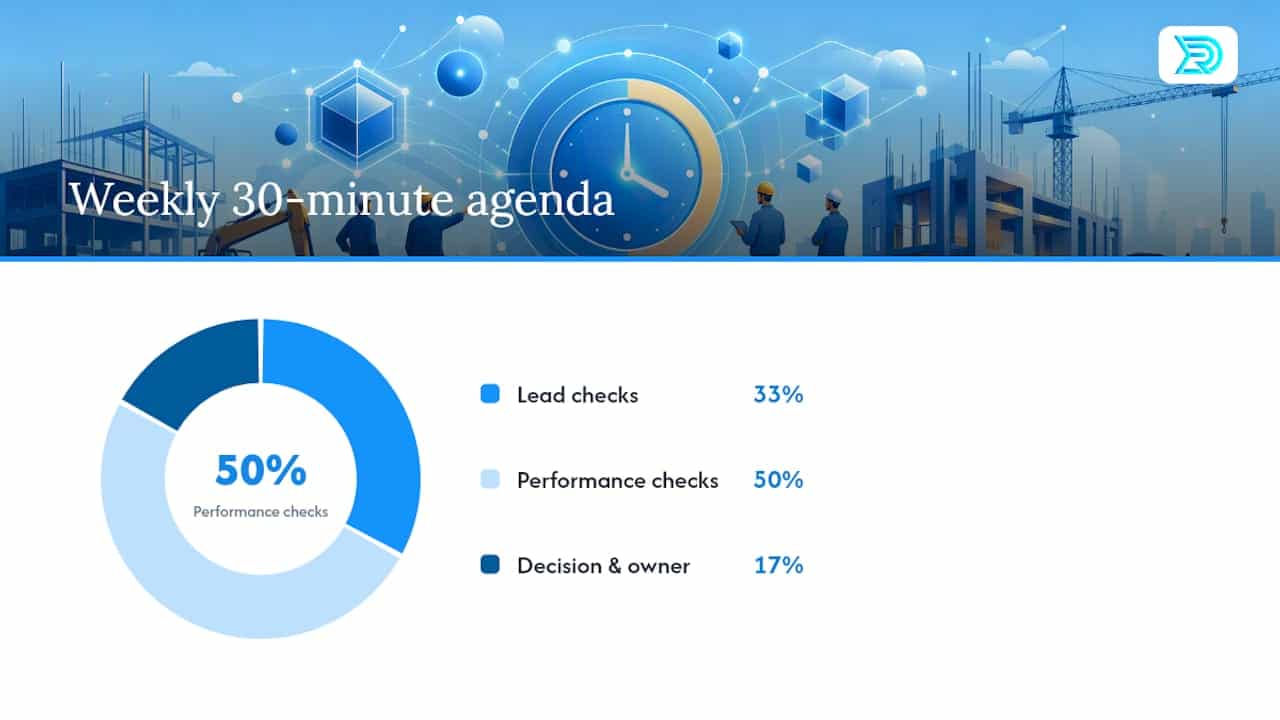
Thirty minutes, one owner or marketing manager, once a week, same day and time every week. That consistency matters more than the meeting length.
Here’s a seven-step checklist that fits comfortably inside 30 minutes:
- Confirm source labeling is clean (2 minutes). Spot-check five new leads for mislabeled or missing source tags.
- Review missed calls (4 minutes). Every missed call is a lead you paid for and lost for free.
- Check response speed on new leads (4 minutes). Anything over an hour needs a name attached to it.
- Check estimate status (5 minutes). How many estimates are sitting unfollowed for more than three days?
- Review booked revenue against pacing (5 minutes). Are you on track for the month, ahead, or behind?
- Check your margin band (5 minutes). Booked revenue means nothing if margin has quietly slipped.
- Pick exactly one fix and name an owner (5 minutes). Not three fixes. One.
Pro Tip: Write the fix and owner in the same sheet or slide every week, dated, so you can see three months later whether last month’s fix actually stuck. This single habit is what separates a dashboard that drives decisions from one that just gets glanced at.
Owner-focused dashboards that follow this exact structure, leads, estimates, booked jobs, revenue, response speed, and margin signal, tend to hold up because every metric earns its place by prompting a decision.
What Mistakes Wreck a Contractor Advertising Dashboard?
The most common failure isn’t a data problem. It’s a discipline problem dressed up as a data problem.
- Vanity-metric overload. Impressions, click-through rate, and page views feel productive to stare at but rarely change a Monday decision. Cut anything from the owner screen that doesn’t map to an action.
- No single source of truth. When your CRM says 40 booked jobs and your accounting export says 36, nobody trusts either number, and the dashboard gets ignored.
- Stopping at lead counts. Lead volume without booked revenue attached tells you nothing about whether a channel is actually profitable.
- Overbuilding the dashboard. A 15-tab spreadsheet gets reviewed once and abandoned. A one-screen scorecard gets reviewed every week.
- Ignoring invalid leads. Track and dispute bad Local Services Ads leads promptly, since uncontested invalid leads permanently inflate your CPL and CAC and quietly poison every decision built on those numbers.
Fix the labeling and the review habit first. Everything else is secondary.
How Do You Maintain and Scale the Dashboard as You Grow?
Your dashboard should get slightly more sophisticated as revenue grows, not more complicated for its own sake.
- Add automation once manual updates take more than 30 minutes a week. Alerts for missed calls or slow estimate follow-up are usually the first automation worth building.
- Adjust cadence with revenue. A single-crew operation might review weekly and go deeper monthly; a multi-crew operation often needs a daily glance at response speed alongside the full weekly review.
- Add segmentation carefully. Breaking KPIs out by service line, crew, or zip code is valuable, but only once your source labeling is clean enough that the extra dimension doesn’t just multiply the mess.
- Keep a change log. Every time you adjust a calculation, a source label, or a KPI definition, write down the date and reason, since a dashboard that quietly changes its own math is worse than no dashboard at all.
- Move to a platform layer when reconciliation gets heavy. Attribution or field-service reporting tools reduce manual work once you’re managing multiple markets or crews, while the owner scorecard itself should stay recognizable throughout that transition.
Security matters here too. Every integration you add, call tracking, ad accounts, CRM, accounting, widens the surface area for a data leak or a mishandled customer record. Limit dashboard access to people who need it for a decision, not everyone on the team, and rotate API credentials when a connector vendor or employee changes.
Results Digital: What Real Client Dashboards Look Like
A Florida roofing client Resultsdigitalus worked with grew from 3 crews to 18 before selling for $60 million, and a clean owner scorecard was part of how that growth stayed visible month over month instead of getting buried in spreadsheets nobody trusted.
Resultsdigitalus builds owner scorecards around the same source-label discipline covered above: a locked list of channel names enforced at intake, a single join path from lead to booked revenue, and a weekly review built into the client relationship rather than an optional add-on.
The starter fields we push every roofing and exterior client to track first are lead source, response time, estimate status, and booked revenue by channel. Get those four clean before adding anything else. Everything downstream depends on that foundation holding.
If you want a partner to build and maintain this instead of doing it solo, Resultsdigitalus’s digital marketing services for roofers fold dashboard governance into ongoing campaign management, with no long-term contract locking you in if the reporting doesn’t earn your trust.
Turn Your Dashboard Into a Weekly Habit, Not a Report
A contractor marketing dashboard only works when it’s a single owner scorecard reviewed for 30 minutes weekly, and that habit matters more than which software you choose.
Building the dashboard is the easy part. Sustaining the weekly discipline is where most contractors quietly give up, usually around week three, right when the novelty wears off and the numbers stop feeling exciting. If your team doesn’t have the bandwidth to keep source labels clean and run that review every single week, that’s exactly the gap a marketing partner should close. Resultsdigitalus’s website optimization services for contractors pair dashboard governance with the conversion work that actually moves CPL and CAC in the right direction, and for general contractors specifically, the SEO services built for your trade tie search performance directly back to the booked-revenue numbers your dashboard already tracks.
Where to Find Starter Templates and Official Guidance
- Start with the seven-KPI framework and weekly review cadence as your baseline template structure.
- Reference the owner scorecard checklist for exactly what belongs on a single screen.
- Consult the SBA’s financial reporting guidance for connecting marketing measurement to margin tracking.
- Review Lurion’s owner dashboard approach for a CSV-first starter workflow that avoids ripping out existing systems.
- Compare pricing shape for mid-market attribution tools like WhatConverts before committing to a monthly platform fee.
Why the Simple Dashboard Beats the Sophisticated One
Most advice on this topic pushes contractors toward more integrations, more automation, more dashboard before they’ve proven they’ll actually look at it every week. That’s backward. The research consistently points to the opposite lesson: a messy spreadsheet reviewed religiously every Monday beats a beautifully automated dashboard that gets opened once a quarter.
The conventional wisdom oversells the tooling decision and undersells the habit. Whether you use a free Looker Studio template or a paid attribution platform matters far less than whether someone sits down for 30 minutes every week and commits to one fix. Contractors who skip straight to enterprise reporting layers before they’ve even standardized their source labels usually end up with expensive dashboards showing the same unreliable numbers, just in nicer colors.
Start with the seven KPIs, a spreadsheet, and a standing Monday meeting. Add sophistication only when the weekly habit is already proven, not before.
Sources
- Essential Contractor Marketing Dashboard for 2026 – PipelineOn
- Contractor Marketing Dashboard: What to Track Weekly | ProTradeHQ
- Manage your finances | U.S. Small Business Administration
- Lurion — owner dashboards
